There's much chatter about China falling into deflation after its July 2023 CPI report showed a -0.3 percent year-on-year decline. The food and beverage component of CPI showed a -0.5 percent year-on-year decrease that reflected mainly a crash in meat prices--especially a 26 percent decrease in pork prices from a year ago. Meanwhile, China's Q2 2023 index of farm prices (most recent available) showed a tiny -0.4 percent decrease from last year.
Looking at prices of individual commodities from China's grain bureau, ag ministry, and rural market prices shows a falling trend or plateau for many commodities that began early in 2023 as the post-COVID-lockdown recovery narrative began to vaporize. Signs of deflation are surprisingly evident in Chinese ag prices, despite farmers abandoning land, floods, and downward pressure from surging imports.
Chinese soybeans are a clear example. Xi Jinping ordered an increase in soybean production last year to reduce reliance on imported beans as a major national security initiative. Statisticians reported a record 20-million-ton harvest, but it glutted the market. Average soybean procurement prices reported by China's Administration of Grain and Commodity Reserves were strong until September 2023 when the new Chinese harvest came online. Then prices immediately began to plummet, an the slide continued throughout the marketing year except for a brief bump in March-April when purchases for reserves briefly elevated prices. The July 2023 domestic Chinese soybean procurement price was down 15 percent from a year earlier. These prices tell a more pessimistic story than China's official farm price index which showed a small 2-percent decrease in soybean prices as of Q2 2023. Meanwhile, China's soybean imports are up 15 percent so far this year, with 9.7 million tons imported in July 2023 alone.

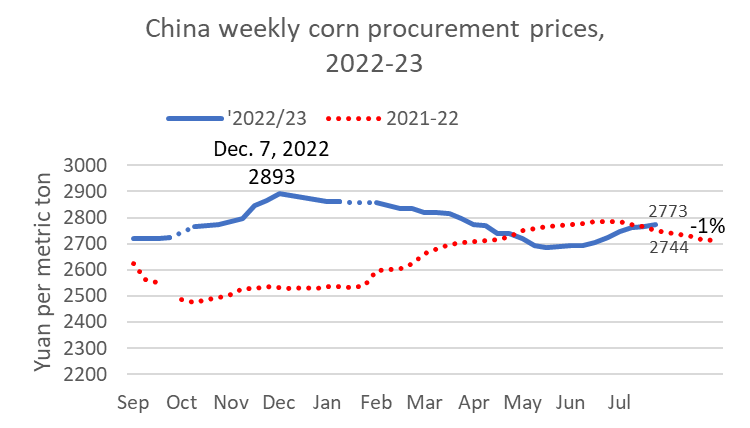
Chinese corn prices rose after the 2022 Russia invasion of Ukraine and increased some more in the first months after the 2022 harvest until reaching a peak in December 2022. Then weakness set in for Chinese corn prices in December. Chinese corn prices softened during 2023 and are now very close to their year-earlier level.
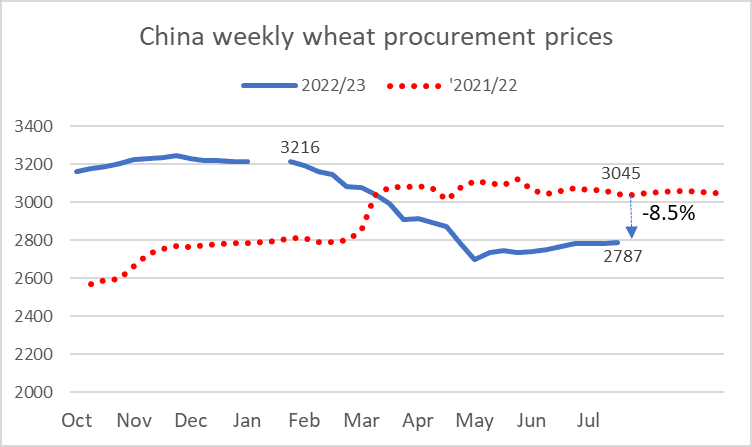
Chinese wheat prices also showed a clear bump in 2022 after the invasion of Ukraine. Like corn prices, wheat prices began dropping early in 2023. The fall in wheat prices ended abruptly in May 2023 as heavy rains damaged the new winter wheat crop in some key production areas of China. The rebound in wheat prices over the summer has been barely perceptible. July 2023 wheat prices were down 8.5 percent from year-earlier levels.
Chinese hog prices were on the way up a year ago, but they peaked in October 2022 and fell sharply late in the year as a surplus of hogs was dumped into a weaker-than-expected market. Prices deteriorated further in 2023. July hog prices were down 32 percent from a year earlier.


Comments
In fact, China's economy is red hot.
GDP is $30 trillion PPP
5% growth = $1.5 trillion.
$1.5 trillion = more than the GDP of 192 countries.
$1.5 trillion = more than US + EU growth combined.
$1.5 trillion = 30% of global growth.
America's 1% growth = 9% of global growth.