
Declining fertilizer use = shrinking cropland base?

Chinese data show a decline in chemical fertilizer that purportedly demonstrates their farmers are reversing their notoriously excessive fertilizer use. But what if the decline in fertilizer use actually reflects a decline in China's agricultural production?

China reported another record grain harvest last week for 2023, Many observers in China were skeptical about the data since the farmland base has been shrinking, there were floods and drought this year, and grain imports are up 7 percent so far in 2023. State media issued a rebuttal to these suspicions, insisting the data are correct.

Chinese statistics show a 17-percent decrease in use of chemical fertilizer use from 2015 to 2022, yet grain output has increased in all but one year during that time--more grain with less fertilizer. Hmm... 2015 was the year Chinese officials launched an action plan to cut annual growth in fertilizer use to zero by 2021. The statistics immediately began showing a decrease in fertilizer use!  

How can crop output go up with less fertilizer applied? Chinese officials claim their farmers have produced more grain with less fertilizer because fertilization has become more efficient, but there's no evidence on the ground of this improvement. 

Data from China's National Bureau of Statistics.

An annual farm cost of production survey conducted by China's National Development and Reform Commission (NDRC) reports no decrease in use of chemical fertilizer use. In fact, fertilizer use intensity has been rising since 2015 for some crops like cotton and wheat. This data is probably not manipulated since it is generally not seen by the public, and you have to look really hard to find the section of the survey with fertilizer use.

15 mu = 1 hectare. Data compiled from China National Development and
Reform Commission farm production cost surveys
.

Compare the fertilizer use intensity calculated from two data sources. First, the aggregate amount of fertilizer use per hectare of area sown to crops. Second, a weighted average of the NDRC farm survey (each crop's average fertilizer use per hectare weighted by area sown to each crop).

In the chart below it is evident that the official fertilizer data (red line) is surprisingly smooth. Second, it's evident that the two estimates of fertilizer use were fairly close until 2015 when they diverged. The aggregate fertilizer use started dropping, while the estimate from surveys fluctuated around a near constant mean of 400 kg/ha.  


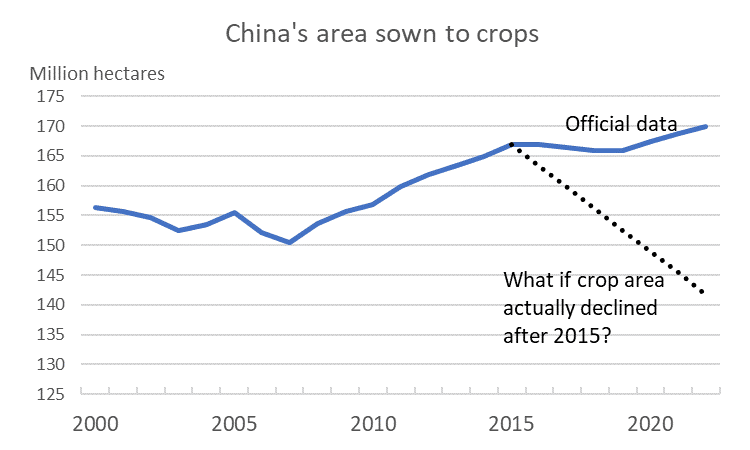
These statistics appear contradictory, but what if both statistics are actually accurate? What if per-hectare applications have been stable or increasing, and aggregate fertilizer use is dropping because the area sown to crops has been dropping--i.e. less fertilizer is used because less land is planted in crops? In other words, maybe it's the crop area data that is bogus. 

Another thing happened after 2015. China began to address a massive corn surplus by cutting the price support and then removing it altogether in 2016. After the price support was removed, Chinese corn prices dropped about 30%. The reduced profits were briefly said to discourage farmers from planting corn before this story was memory-holed. (Conversely, much of the run-up in area sown during 2010-15 was due to the profitability of corn, so it's plausible that the drop in corn prices reversed and wiped out those previous gains in area.) Chinese officials do seem panicked about declines in crop area over the last 3 years.
Data from China National Bureau of Statistics and calculations.

A thought experiment: Trial and error calculations indicate that it would have taken a 15% decrease in crop area to keep the ratio of fertilizer use per hectare roughly constant from 2015 to 2022--assuming the aggregate fertilizer use statistic is accurate. A decline in crop area of this magnitude seems too large, but China's growth in crop area data does not seem plausible.
Chart shows ratio of aggregate fertilizer use to sown area in crops. 


Comments

Popular posts from this blog

Xi Jinping's Doctoral Thesis

Xi Jinping is the vice president and presumed next president of China but little is known about him. In this post the dimsums blog offers its contribution to the genre of Xi Jinping-ology by conveying Xi's decade-old views on agricultural markets. Ten years ago Xi Jinping wrote a thesis, "Tentative Study of Agricultural Marketization" (中国农村市场化研究) for a Doctor of Law degree at Tsinghua University in Beijing, a top breeding-ground for Chinese officials. The dimsums blogger has spent several hours poring over the 200-plus page tome to see what it reveals about Dr. Xi. The thesis is remarkably close to what China has been doing lately in agricultural policy, suggesting that Xi (or the person who actually wrote the thesis) has a major say in policy or is at least in agreement with what's being done. There is nothing adventurous, controversial (or insightful) in the thesis. It seems to be the work of a wonkish technocrat who is not prone to talk out of turn or wander from...

Divergence in U.S. & Chinese egg prices

High egg prices are a hot topic in the United States. China, in contrast, has a glut of eggs and depressed prices.  The March 14, 2025 USDA Agricultural Marketing Service weekly eggs market overview reported that U.S. egg prices continued declining during the second week of March as the supply situation improved. No significant highly pathogenic avian influenza (HPAI) outbreaks have occurred in March and U.S. egg demand is relatively light. The average U.S. wholesale price for Grade A large white eggs was $4.15 per dozen, down sharply from their February peak.  Until 2021, Chinese and U.S. wholesale egg prices had been roughly equal at about $1-to-$2 per dozen with no trend. U.S. prices fluctuated more than Chinese prices, so the U.S. price was sometimes higher, sometimes lower than the Chinese price after converting them to dollars per dozen.  Chinese prices converted using monthly exchange rate and assuming 0.6 kg per dozen. Sources: USDA and China Ministry of Agricult...

China's Corn & Wheat Imports Down 97% From Last Year

China's first customs data for 2025 feature a 97-percent decline in corn and wheat imports from a year earlier. Soybean imports were up slightly by volume (but down in value), and dairy, pork, poultry, and seafood imports rebounded year-on-year. Life was less sweet in China with a 93.7% decline in sugar imports, and drinking appears to be up as wine and beer imports posted gains.   China's agricultural imports for January-February 2025 were down 14.7 percent from a year earlier. The value of farm and food goods imported for the first two months of 2025 totaled $30.7 billion, down $5.26 billion from the same period in 2024. China's exports of agricultural products during January-February totaled $15.2 billion, up $393 million from a year earlier.  Data from China Customs Administration website. As usual, soybeans were the largest component of China's agricultural imports during January-February 2025 with a value of $6.3 billion. Meat imports were valued at $4.1 billion, ...